Categories
Tools

Tools for developers: Logitech MX Keys

For software developers is a good keyboard essential, I use a keyboard much more than a mouse.

Logitech K750

Many years I used the Logitech K750 keyboard – this is a very thin keyboard with tiny solar panels. In normal office lighting conditions, you never need to charge the keyboard, it actually doesn’t have any USB ports to charge it with. After a few years, the chargeable button cell fails – Logitech does not want you to replace the battery, but it is possible, just search Youtube. This keyboard lasted many years and I have used 3 of those. Unfortunately Logitech does not make them anymore so I looked for a replacement.

I have been searching for an affordable keyboard that can fit in my backpack. Since I don’t use the numerical part of the keyboard, I used the Logitech K380. This one is very compact and also supports Bluetooth – you can pair it with your smartphone or tablet. Since it is very compact, it fits very well in my backpack.

Logitech K380

The keys on this keyboard feel very nice and I thought this was a good replacement. After using it for several weeks, it started annoying me that I made more typing mistakes than I was used to. Because this keyboard is so compact, the spacing of the keys is also smaller – the distance from the q to the p key is 163 mm. On a regular keyboard, this distance is 172 mm. It doesn’t seem much, but is makes a big difference in typing. After using the compact K380, my hands feel a bit cramped. That, combined with the typing mistakes made me consider other keyboards.

I tried the Logitech K360, that one has a full size 172 mm layout, but the keys are smaller and a bit mushy. I also missed (also a problem with the K380) the easy access of the home, end and page up/down keys.

Logitech K360

I saw the Logitech MX Keys in the store and they seemed nice, but I thought that the price of 115 euros was ridiculously high. But, after some more suffering from my previous keyboards I decided to purchase one. I found it for sale at 90 euros at alternate.nl.

Logitech MX Keys

At first glance, this is a very solid keyboard – the base is made from metal and it has substantial weight. It has backlight key illumination – very nice, but I hardly use it, since I don’t work in the dark. You charge it up with a USB C cable and will require only very infrequent (5 months) charging. It support the usual Logitech USB unifying dongle and also Bluetooth.

The typing experience is just great – no clicky keys, but nice firms keys with a good feedback. It’s a pity that this keyboard doesn’t come as a smaller tenkeyless version; I want the home, end, page up/down keys, but I don’t need the digits keypad. It fits in my backpack, but it is large and heavy. The media keys at the top are surprisingly useful, even in Ubuntu Linux. The escape key is large and makes Intellij and vim much easier to use. Because Logitech added support for the Mac, the start and alt keys are a bit messy with opt and cmd symbols, but you get used to it.

In conclusion, I love the Logitech MX keys. I think that it is the best keyboard I ever used.

Categories
Angular

Simpler unit tests in Angular

The Angular command line interface (ng-cli) generates the code for a component for you, including html, stylesheet, component code and a unit test. It will generate a unit test, I added the necessary import and mocked service:

describe('PortfolioComponent', () => {
  let component: PortfolioComponent;
  let fixture: ComponentFixture<PortfolioComponent>;
  let stockService = mock(StockService);

  beforeEach(async(() => {
    TestBed.configureTestingModule({
      imports: [BrowserModule, BrowserAnimationsModule, FormsModule,
        ButtonModule, CalendarModule, DialogModule, DropdownModule, PanelModule, TableModule],
      declarations: [ PortfolioComponent ],
      providers: [
        {provide: StockService, useValue: instance(stockService)}
      ],
    })
    .compileComponents();
  }));

  beforeEach(() => {
    fixture = TestBed.createComponent(PortfolioComponent);
    component = fixture.componentInstance;
    fixture.detectChanges();
  });

  it('should create', () => {
    expect(component).toBeTruthy();
  });
});

The unit test above will setup a TestBed with imports and providers to make it possible to render the component. This will make sure that the HTML template will work with your component code. This is all great, but it comes with a price. When I do this, it takes more time to figure out which modules and services it needs. It also takes a bit longer to setup the TestBed and execute the unit test. On my machine this simple test took 550 milliseconds. I used ts-mockito to mock the service.

describe('PortfolioComponent (Unit test)', () => {
  let component: PortfolioComponent;
  let stockService = mock(StockService);

  beforeEach(async(() => {
    component = new PortfolioComponent(instance(stockService));
  }));

  it('ngOnInit', () => {
    component.ngOnInit();

    expect(component.portfolioRows.length).toBe(2);
  });

  it('refreshPortfolioPrices', () => {
    let response0 = new StockLatestPriceResponse();
    response0.latestPrice = 1.23;
    when(stockService.getStockLatestPrice("AAPL")).thenReturn(of(response0));
    let response1 = new StockLatestPriceResponse();
    response1.latestPrice = 2.34;
    when(stockService.getStockLatestPrice("GOOG")).thenReturn(of(response1));

    component.ngOnInit();
    component.refreshPortfolioPrices();

    expect(component.portfolioRows.length).toBe(2);
    expect(component.portfolioRows[0].latestPrice).toBe(1.23);
    expect(component.portfolioRows[1].latestPrice).toBe(2.34);
  });
});

Instead of setting up the TestBed, you just instantiate the component with its constructor and mocked service. You can run the same tests and this time it takes only 11 milliseconds. Compared with the TestBed, this takes only 1/50th of the time. If you have a substantial amount of tests, this save quite a lot of time.

The drawback is of course that you don’t test the component template. You can separate tests that include these templates with the TestBed; I have created portfolio.component.spec.ts and portfolio.component.unit.spec.ts to separate component and unit test.

See my Github repository: https://github.com/koert/stock-portfolio/tree/master/spring-boot/src/main/angular/src/app/portfolio

Conclusion:
A pure unit test without TestBed:
– doesn’t test component template
– not dependent on module import, less brittle
– is 50 times faster

Categories
Cloud

Deployment on Amazon Web Services

In my previous article I have setup an Angular application with a Quarkus backend and produced a Docker image. You can deploy this image directly with Docker, or run on a Kubernetes cluster. To evaluate how easy it is to deploy this image at AWS, I started looking at Amazon Elastic Container Service (AWS ECS).

After registering and installing command line tools.Setting up security policy

aws iam --region eu-west-1 create-role --role-name ecsTaskExecutionRole --assume-role-policy-document file://config/task-execution-assume-role.json

aws iam --region eu-west-1 attach-role-policy --role-name ecsTaskExecutionRole --policy-arn arn:aws:iam::aws:policy/service-role/AmazonECSTaskExecutionRolePolicy

Configure a cluster

ecs-cli configure --cluster portfolio --default-launch-type FARGATE --config-name portfolio --region eu-west-1

You have to setup an Administrator user in IAM and create an access key. Easiest way is to use the IAM console. .Configure profile

ecs-cli configure profile --access-key <ACCESS_KEY> --secret-key <SECRET_KEY> --profile-name portfolio-profile

Create the cluster

ecs-cli up --cluster-config portfolio --ecs-profile portfolio-profile

Output

#INFO[0000] Created cluster                               cluster=portfolio region=eu-west-1
#INFO[0000] Waiting for your cluster resources to be created...
#INFO[0000] Cloudformation stack status                   stackStatus=CREATE_IN_PROGRESS
#INFO[0061] Cloudformation stack status                   stackStatus=CREATE_IN_PROGRESS
#VPC created: vpc-01234567890
#Subnet created: subnet-01231231231223123
#Subnet created: subnet-02342342342342344
#Cluster creation succeeded.

Find group ID

aws ec2 describe-security-groups --filters Name=vpc-id,Values=vpc-01234567890 --region eu-west-1

Output

#  "OwnerId": "091823891238",
#  "GroupId": "sg-01231231231231233",

Authorize ports

aws ec2 authorize-security-group-ingress --group-id sg-01231231231231233 --protocol tcp --port 80 --cidr 0.0.0.0/0 --region eu-west-1
aws ec2 authorize-security-group-ingress --group-id sg-01231231231231233 --protocol tcp --port 8080 --cidr 0.0.0.0/0 --region eu-west-1

Bring the cluster up

ecs-cli compose --project-name portfolio service up --create-log-groups --cluster-config portfolio --ecs-profile portfolio-profile

Output

#INFO[0000] Using ECS task definition                     TaskDefinition="portfolio:3"
#WARN[0000] Failed to create log group portfolio in eu-west-1: The specified log group already exists
#INFO[0000] Created an ECS service                        service=portfolio taskDefinition="portfolio:3"
#INFO[0001] Updated ECS service successfully              desiredCount=1 force-deployment=false service=portfolio
#INFO[0016] (service portfolio) has started 1 tasks: (task b0161234-bde5-44c1-1234-3d66caab1233).  timestamp="2020-02-06 14:07:16 +0000 UTC"
#INFO[0046] Service status                                desiredCount=1 runningCount=1 serviceName=portfolio
#INFO[0046] ECS Service has reached a stable state        desiredCount=1 runningCount=1 serviceName=portfolio

Find out IP address

ecs-cli compose --project-name portfolio service ps --cluster-config portfolio --ecs-profile portfolio-profile

Output

#Name                                      State    Ports                         TaskDefinition   Health
#b0161234-bde5-44c1-1234-3d66caab1233/web  RUNNING  163.135.225.218:8080->8080/tcp  portfolio:3  UNKNOWN

Now the application is running and you can access it at the listen IP address and port.Examine the logs

ecs-cli logs --task-id b0161234-bde5-44c1-1234-3d66caab1233 --follow --cluster-config portfolio --ecs-profile portfolio-profile

It runs on just one container – you can scale it up with a simple command.Scaling – use 2 containers

ecs-cli compose --project-name portfolio service scale 2 --cluster-config portfolio --ecs-profile portfolio-profile

Find out scaled up containers and IP addresses

ecs-cli compose --project-name portfolio service ps --cluster-config portfolio --ecs-profile portfolio-profile

You will now see 2 IP addresses and you can access both instances. Normally you would setup a load balancer that sends traffic to both instances. This is beyond the scope of this article.

Update new deployment

Let’s say that you made some improvements and want to deploy a new version. I could not find the option to do this with ecs-cli, but it is pretty straight forward with the “aws ecs update-service” command command.Update image

aws ecs update-service --service portfolio --cluster portfolio --force-new-deployment

This will first deploy the new version, keep both version running for a short time and then removes the old instance.

Clean up

The clean up your experimental deployment, you first stop the instance and then delete the cluster.Stop the instance

ecs-cli compose --project-name portfolio service down --cluster-config portfolio --ecs-profile portfolio-profile

Output

#INFO[0000] Updated ECS service successfully              desiredCount=0 force-deployment=false service=portfolio
#INFO[0000] Service status                                desiredCount=0 runningCount=1 serviceName=portfolio
#INFO[0015] Service status                                desiredCount=0 runningCount=0 serviceName=portfolio
#INFO[0015] (service portfolio) has stopped 1 running tasks: (task b0161234-bde5-44c1-1234-3d66caab1233).  timestamp="2020-02-06 10:56:53 +0000 UTC"
#INFO[0015] ECS Service has reached a stable state        desiredCount=0 runningCount=0 serviceName=portfolio
#INFO[0015] Deleted ECS service                           service=portfolio
#INFO[0015] ECS Service has reached a stable state        desiredCount=0 runningCount=0 serviceName=portfolio

Delete cluster

ecs-cli down --force --cluster-config portfolio --ecs-profile portfolio-profile

Conclusion

I am not an AWS wizard, but I found it reasonably easy to setup a cluster and deploy the application. To make the application ready for real world use, there is much more to do, like user registration/login, load balancing, data persistance to a database, etc.

Categories
Java

Quarkus and Angular

I am building an application to keep track of a stock portfolio. This has an Angular front-end with a REST services back-end implemented with Quarkus. The features of the first version: – manually add/remove stocks – retrieve latest prices from Yahoo Finance

This is the architecture of the application:

Project setup

Let us start with an empty project by specifying the extensions on https://code.quarkus.io and download the resulting zip. The necessary extension:

  • RESTeasy JAX-R
  • RESTeasy JSON-B

To make sure the development environment works, you start the development mode with Maven:

mvn compile quarkus:dev

In your browser, enter http://localhost:8080/hello and you will see “hello” as a response.

Add Yahoo finance API dependency

The retrieve the latest stock price, I add this dependency:

  <dependency>
    <groupId>com.yahoofinance-api</groupId>
    <artifactId>YahooFinanceAPI</artifactId>
    <version>3.15.0</version>
  </dependency>

To get the stock information, including price:

Stock stock = YahooFinance.get(symbol);

Stock REST resource

It will be necessary get the latest stock price through a REST service, so we add the StockResource:

  @Path("/{symbol}/latestPrice")
  @GET
  public Response stock(@PathParam("symbol") String symbol) throws IOException {
    Stock stock = YahooFinance.get(symbol);

    Response response = null;
    if (stock == null) {
      response = Response.status(Response.Status.NOT_FOUND).build();
    } else {
      StockLatestPriceResponse stockResponse = new StockLatestPriceResponse(stock.getSymbol(), stock.getQuote().getPrice());
      response = Response.ok(stockResponse).build();
    }
    return response;
  }

We can test this by accessing this URL: http://localhost:8080/stocks/AAPL/latestPrice

Angular front-end

To bootstrap the Angular application, run this in the src/main directory:

ng new portfolio --skipGit --routing=true --style=scss

This creates a new directory “portfolio” with the Angular code. I rename that to “angular” to make it obvious that it contains Angular front-end code.

To run the front-end, change directory to the src/main/angular directory and run ng serve. When you enter “http://localhost:4200” in your browser, you will see the example page with “portfolio app is running”.

I add the PrimeNG package – this contains nice user interface components.

npm install --save primeng
npm install --save primeicons
npm install --save @angular/cdk
npm install --save chart.js
npm install --save @fullcalendar/core

Portfolio page

Next I create a Portfolio page to display the list of stocks, and the service to retrieve the latest price.

ng generate component Portfolio
ng generate service Stock

You can see how I implemented the page on my Github repository.

Stock price service

To retrieve the latest stock price, the StockService calls the REST endpoint implemented in Quarkus.

  getStockLatestPrice(symbol: string): Observable<StockLatestPriceResponse> {
    return this.http.get<StockLatestPriceResponse>(`/stocks/${symbol}/latestPrice`);
  }

To check if it works, you can run ng serve again.

You will see errors in the browser console:

GET http://localhost:4200/stocks/AAPL/latestPrice 404 (Not Found)
GET http://localhost:4200/stocks/GOOG/latestPrice 404 (Not Found)

The Angular service expects that the Quarkus service is available at the same URL prefix, and this is http://localhost:4200. The Quarkus service actually lives at http://localhost:8080, so will will need a proxy.proxy.conf.json

{
  "/stocks": {
    "target": "http://localhost:8080",
    "secure": false
  }
}

If you have started Quarkus with mvn compile quarkus:dev, then you can start the Angular app with ng serve --proxy-config proxy.conf.json.

Combine Quarkus and Angular

So far, the Quarkus service and Angular application are separated. The Angular production build with ng build --prod produces static files that can be served by Quarkus.

By default, ng build --prod puts all produced files in the dist directory. We want those files in the src/main/resources/META-INF/resources directory. You can change that in the angular.json file:angular.json

  "configurations": {
    "production": {
      "outputPath": "../resources/META-INF/resources",

After running ng build --prod, you can start Quarkus with mvn compile quarkus:dev and load the Angular app with http://localhost:8080/index.html

Running the application

Now we have an application that we can deploy and run. Quarkus gives you the ability to run the application as a native executable. When you build the application with mvn package -Pnative -Dquarkus.native.container-build=true -Dmaven.test.skip, it will build a runner executable that contains everything it needs. This executable starts up very quickly and is great for running in a Docker container.

After building the executable, you can build a Docker image and run it:

docker build -f src/main/docker/Dockerfile.native -t quarkus/portfolio .
docker run -i --rm -p 8080:80 quarkus/portfolio

After that, you can access the application at http://localhost:8080/index.html

Categories
Tools

Logitech MX Master 3

Tools for developers – Logitech MX Master 3 mouse

I have been using the original Logitech MX Master mouse daily for many years and stopped working
recently. First the left mouse click sometimes wouldn’t work and later the mouse movement stopped
completely. It was time for a replacement. I first thought about the Logitech MX Master 2S – it is
very similar to the original MX Master, with some improvements. When I was in the store to purchase
the 2S, I noticed the MX Master 3 – there are some differences: the thumb wheel is a little bigger,
the thumb buttons for forward/back have a better place and the main scroll wheel has an electromagnetic
braking system.

The Logitech MX Master 3 is quite expensive: 108 euro. Although I thought this is too much for a mouse,
I realized that I use this all the time and I can spend a bit more on professional tools. As a software
developer, your interface with the computer is a mouse and keyboard. These are the tools of our trade,
so I ended up buying the MX Master 3.

In daily use the MX Master 3 mouse immediately felt very comfortable. I almost forgot that it is a new
mouse, except for the thumb wheel and buttons. These are placed a little different from the old Master
and I sometimes had adjust my thumb to use it. The placement of the forward/button button is much better,
it is now much easier to use them – these buttons on the old mouse were not so use to use.

There is an additional button below the thumb wheel and buttons – this was not so easy to use on the
old mouse, but now has a more distinct click. In Ubuntu Linux this button lets you switch windows quickly
and works great.

The greatest improvement is the scroll wheel. It has a new fly wheel mechanism – the old mouse had a
mechanical braking mechanism and made a rattling sound. The new wheel feels very smooth. When you scroll
fast it spins freely and stops using electromagnets with hardly any noise. When you scroll slowly you
clearly feel the brake and is still quiet. It is a joy to use.

The Logitech Master MX 3 mouse is great for anyone who is a professional computer user – the precision
of this mouse is great and the scroll flywheel is fantastic when you scroll through long documents.
For developers this mouse is great because you can back/forward quickly with the thumb buttons. Also
switching active windows with the thumb button is great for switching between documentation and code.

This is not a sponsored review – I paid for this mouse with my own money.

Categories
Angular

Unit testing Angular components

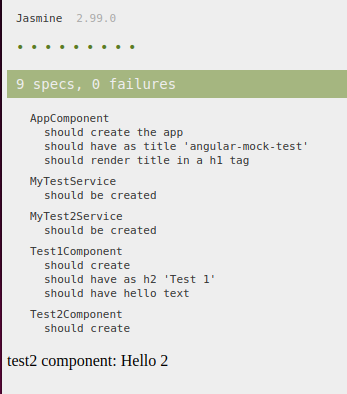
When you create an Angular application and componentes with ths NG command line interface, it creates unit tests for you. The support for unit testing is great, you just run ng test and you will see the results.

angular-mock-test> ng test
 11% building 9/9 modules 0 active24 01 2020 10:52:16.444:WARN [karma]: No captured browser, open http://localhost:9876/
24 01 2020 10:52:16.448:INFO [karma-server]: Karma v3.1.4 server started at http://0.0.0.0:9876/
24 01 2020 10:52:16.448:INFO [launcher]: Launching browsers Chrome with concurrency unlimited
24 01 2020 10:52:16.453:INFO [launcher]: Starting browser Chrome
24 01 2020 10:52:20.714:WARN [karma]: No captured browser, open http://localhost:9876/
24 01 2020 10:52:20.794:INFO [Chromium 79.0.3945 (Linux 0.0.0)]: Connected on socket PQFYob1QwIhZxRoMAAAA with id 41864170
Chromium 79.0.3945 (Linux 0.0.0): Executed 9 of 9 SUCCESS (0.253 secs / 0.243 secs)
TOTAL: 9 SUCCESS
TOTAL: 9 SUCCESS

Mocking services

In many components, you would use a service to retrieve data. In the unit test it is useful to isolate the component from its dependencies like a service with mocks. The ts-mockito library makes it easy to create mocks, control their behavior, and check it they are called correctly.

You first create a mock object:

let mockMyTestService = mock(MyTestService);

With this object you can control the simulated responses of the mock. To make the mocked service available to the component, you create an instance.

providers: [
  {provide: MyTestService, useValue: instance(mockMyTestService)},
]

This way, the component uses an instance of the mock. Then you can program a response with when and thenReturn.

beforeEach(() => {
  fixture = TestBed.createComponent(Test1Component);
  component = fixture.componentInstance;
  when(mockMyTestService.getHello()).thenReturn(of("hello from test"));

  fixture.detectChanges();
});

You can check if the mock was accessed with verify.

verify(mockMyTestService.getHello()).times(1);

Mock child component

Suppose that you use a child component. Test1Component uses Test2Component as a child:

<test2 #testChild2></test2>
@ViewChild("testChild2") private test2Component: Test2Component;

It would be nice if we can isolate Test2Component with a mock.

TestBed.configureTestingModule({
  declarations: [ Test1Component, instance(mockTest2Component) ],
  providers: [
    {provide: MyTestService, useValue: instance(mockMyTestService)},
  ]
})

You will get this error message: Error: Unexpected value '[object Object]' declared by the module 'DynamicTestModule'.

I have solved this by using the ng-mocks library. Use MockComponent() to create a mock.

TestBed.configureTestingModule({
  declarations: [ Test1Component, MockComponent(Test2Component) ],
  providers: [
    {provide: MyTestService, useValue: instance(mockMyTestService)},
  ]
})

With both of the mock libraries you can properly isolate your component and make unit testing much easier.

You can take a look at the code in my repository at Github.

Categories
Kotlin

Error log context with logback with cleanup

Log context limitations

In another article I created a Logback appender that collect log events and only writes those events to a log file when an error occurs. I did a fairly simple implementation that collects events in a ThreadLocal variable. The potential problem is that the list in the ThreadLocal can grow if it is never properly cleaned up.

Another issue is that in modern Java, you can easily use multiple threads with collections and parallelStream. My solution will collect a context for each stream because each stream runs in its own Thread and create a separate ThreadLocal.

This may lead, over time, to memory leaks.

Size limit and automatic cleanup.

To address these issues, I added a check in the code to make sure that the context does not grow uncontrollably. The code simply checks the size of the event list and removes events that are older than a set maximum age.

  if (events.size > maxContextSize) {
      val minTimestamp = System.currentTimeMillis() - maxEventAge;
      events = events.stream()
              .filter {eventItem ->
                  if (eventItem is ILoggingEvent) {
                      eventItem.getTimeStamp() > minTimestamp
                  } else {
                      true
                  }
              }
              .collect(Collectors.toList())
  }
  events.add(event)

You may notice that this is not Java code, but Kotlin. I created a new implementation in Kotlin to get more experience with Kotlin. I like the language – it is similar to Java and at the same time different in many ways.

The above solution removes events that are older than a certain number of milliseconds. At first I thought this was a nice solution – you probably do not need events that happened 30 seconds ago, for example. On second thought, it could be that the application logs many events in a short time and in that case, no events will be removed at all and it will go through the loop every time – bad for performance.

A safer and simpler solution is to cut the list in half and effectively remove half of the events in the list.

  events = events.subList(events.size/2, events.size)

In the logback configuration, you can specify which appender to write the error log context to with errorLogger and errorAppender elements.

  <appender name="contextAppender" class="logback.LogContextAppender">
    <errorLogger>errorLogger</errorLogger>
    <errorAppender>errorAppender</errorAppender>
    <maxContextSize>40</maxContextSize>
  </appender>

You will get a slight performance hit every time the limit is reached – I guess that is the price to pay for convenience, just like the JVM garbage collection.

You can look at the code on GitHub: https://github.com/koert/logback-context-kotlin

Categories
Java

Error log context with logback

Detailed logging

When you are developing software, you often come across unexpected situations that your software doesn’t handle correctly. In order to figure out what caused the problem, you need a detailed log of what happened and what the input data was, so that you can reproduce the situation in your development or test environment.

Sometimes the end users will produce situations and errors that we never thought of. In those circumstances it is very helpful to examine the detailed logs. Because of this, we let the software log detailed debugging information, even on the production systems. The downside is that this will produce large log files, which may fill up file systems, and there is a performance penalty for writing all that data.

Only detailed logging with error

It would be much more helpful to log all the details only when an error occurred. I came across this idea to log all the detailed debugging logs in memory and when an error occurs write this to a log file. In the logback logging library you can define your own log appender that can keep the log events in memory.

In a web service or web application request, this will be the process: – start and clear a list of log events in a ThreadLocal variable – for each append to the log, append the event to the list in ThreadLocal – when an error occurs, read the stored list of log events and append them to another log appender that will write them to a log file – at the end of the web application request or service, clear the list of log events

Log debugging context with error

The LogContextAppender records all log events in a List in ThreadLocal. When an error events comes in, the appender will send all recorded events to a separate incident appender and will clear the list.

  protected void append(E event) {
    events.get().add(event);
    if (event instanceof ILoggingEvent) {
      ILoggingEvent loggingEvent = (ILoggingEvent) event;
      Marker marker = loggingEvent.getMarker();
      if (marker != null && marker.contains("resetSession")) {
        this.clearLog();
        events.get().add(event);
      }
      if (loggingEvent.getLevel().isGreaterOrEqual(Level.ERROR)) {
        this.writeLogToIncidentLogger();
        this.clearLog();
      }
    }
  }

The application will need the reset the collected log events in the LogContextAppender to minimize the memory usage and unnecessary clutter of your error log context. You do that by logging with a marker:

log.debug(MarkerFactory.getMarker("resetSession"), "reset log context session");

In a typical application, you clear the log session at the start and end of a web application or service request. Usually you do this in a javax.servlet.Filter.

public class LogContextFilter implements Filter {

  private static final Logger log = LoggerFactory.getLogger(LogContextFilter.class);

  @Override
  public void init(FilterConfig filterConfig) throws ServletException {
  }

  @Override
  public void doFilter(ServletRequest request, ServletResponse response, FilterChain chain)
      throws IOException, ServletException {
    log.debug(MarkerFactory.getMarker("resetSession"), "start of request");

    try {
      chain.doFilter(request, response);
    } finally {
      log.debug(MarkerFactory.getMarker("resetSession"), "end of request");
    }
  }

  @Override
  public void destroy() {
  }
}

In the logback configuration, you can specify which appender to write the error log context to with errorLogger and errorAppender elements.

  <appender name="contextAppender" class="logback.LogContextAppender">
    <errorLogger>errorLogger</errorLogger>
    <errorAppender>errorAppender</errorAppender>
  </appender>

Example configuration

This configuration will log everything to standard output:

<configuration>
  <statusListener class="ch.qos.logback.core.status.OnConsoleStatusListener" />

  <appender name="stdout" class="ch.qos.logback.core.ConsoleAppender">
    <filter class="ch.qos.logback.classic.filter.ThresholdFilter">
      <level>INFO</level>
    </filter>
    <encoder>
      <pattern>%d{ISO8601}|%level|%logger{36}|%line|%msg%n</pattern>
    </encoder>
  </appender>

  <appender name="errorAppender" class="ch.qos.logback.core.ConsoleAppender">
    <encoder>
      <pattern>%d{ISO8601}|%level|%logger{36}|%line|%msg%n</pattern>
    </encoder>
  </appender>

  <appender name="contextAppender" class="logback.LogContextAppender">
    <errorLogger>errorLogger</errorLogger>
    <errorAppender>errorAppender</errorAppender>
  </appender>

  <logger name="errorLogger">
    <appender-ref ref="errorAppender"/>
  </logger>

  <root level="DEBUG">
    <appender-ref ref="stdout"  />
    <appender-ref ref="contextAppender"  />
  </root>
</configuration>

Normally, this will log info, warning and error log events to the “stdout” appender. When an error occurs, the contextAppender will log everything into the errorLogger/errorAppend.

This approach will can give you a detailed log of what happened just before the error and will also reduce the amount of logging that your application will produce.

https://github.com/koert/logback-config

Categories
Angular

Electron with Angular 2

Electron logo

Since Angular 2 is finally released, we can now use it to create a production-ready web application. I recently noticed the Electron framework (http://electron.atom.io/) – it allows you to develop desktop applications using NodeJS and the JavaScript framework of your choice.

A project that I am working on needs start helper (Windows) applications and access to local files, so I decided to start developing an Electron application with Angular 2.

It seems a bit hard to find a starting point for an Electron/Angular project. I found a boilerplate project on GitHub, and unfortunately the Angular dependencies are out of date. I forked that boilerplate and fixed the dependencies. This is my repository:

https://github.com/koert/angular2-electron-boilerplate

Categories
Java Software development

Jenkins Multibranch Pipeline

jenkins-logoI recently upgraded Jenkins (https://jenkins.io) to the 2.0 version and had to setup all the jobs again. It is quite a manual process and I wonder if this can be automated in some way.

Gradle plugin

There exists a Gradle plugin (a plugin to use in a Gradle build script) to automate setting up a Jenkins server, see https://github.com/ghale/gradle-jenkins-plugin/wiki. This solution automates the one-time process of setting up jobs. I find this approach interesting, although a bit too much at this point.

Multibranch Pipeline jobs

In the Jenkins 2.0 version, I noticed Multibranch Pipeline jobs – these jobs get most of their configuration from a script that you put in the source repository. This is a great solution, since you can version the configuration and don’t have the manually enter at the Jenkins user interface. Another great feature is that a multibranch pipeline scans your Git repository for branches and builds all of those branches automatically.

option-multibranch

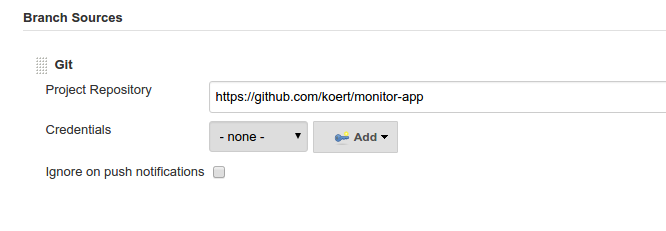
The way you configure a Multibranch Pipeline is by configuring the repository and how the build is triggered. The easiest way is to trigger periodically. That is all the configuration that you enter on the Jenkins user interface.

Selection_031

After this configuration, Jenkins will look at all your branches in the repository and look for a file in the root with the name “Jenkinsfile”. This file should contain a Groovy script that performs the build.

node {
 checkout scm
 sh "./gradlew clean build"
}

This script will checkout the branch from the repository and execute “./gradlew clean build”. After you added this file to your repository, you can manually trigger Jenkins with Build Indexing/Run Now. You will will see a list with all the branches that have a Jenkinsfile.

jenkins-branch-master


This is great if you want to make sure that the code that is committed the repository actually compiles.

To take a step further, you probably want to run your unit tests and show the results. You can just use the “test” task:

node {
 checkout scm
 sh "./gradlew clean test"
}

This will run the build and test in one step. To make a clearer overview of the whole process, you can defines stages and impose timeouts:

node {
 stage 'checkout'
 checkout scm

stage 'build'
 timeout(time: 15, unit: 'MINUTES') {
 sh "./gradlew clean build"
 }

stage 'test'
 timeout(time: 15, unit: 'MINUTES') {
 sh "./gradlew test"
 }
}

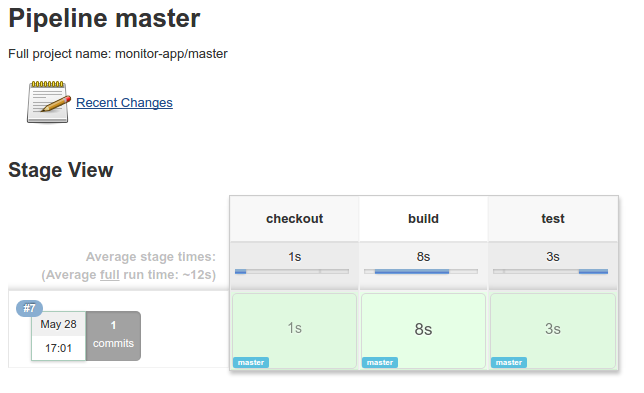
This will produce a nice report of all the stages.

jenkins-stages

Now you can quickly see how long each stage took and if it is successful.

It would also be nice to show the results of the tests, and I will explore that in another post.